
6.0
Virginia marriages per 1,000 residents
Virginia's reported marriage rate in 2024, based on marriages occurring in the Commonwealth.
Source: CDC/NCHS, 2024 data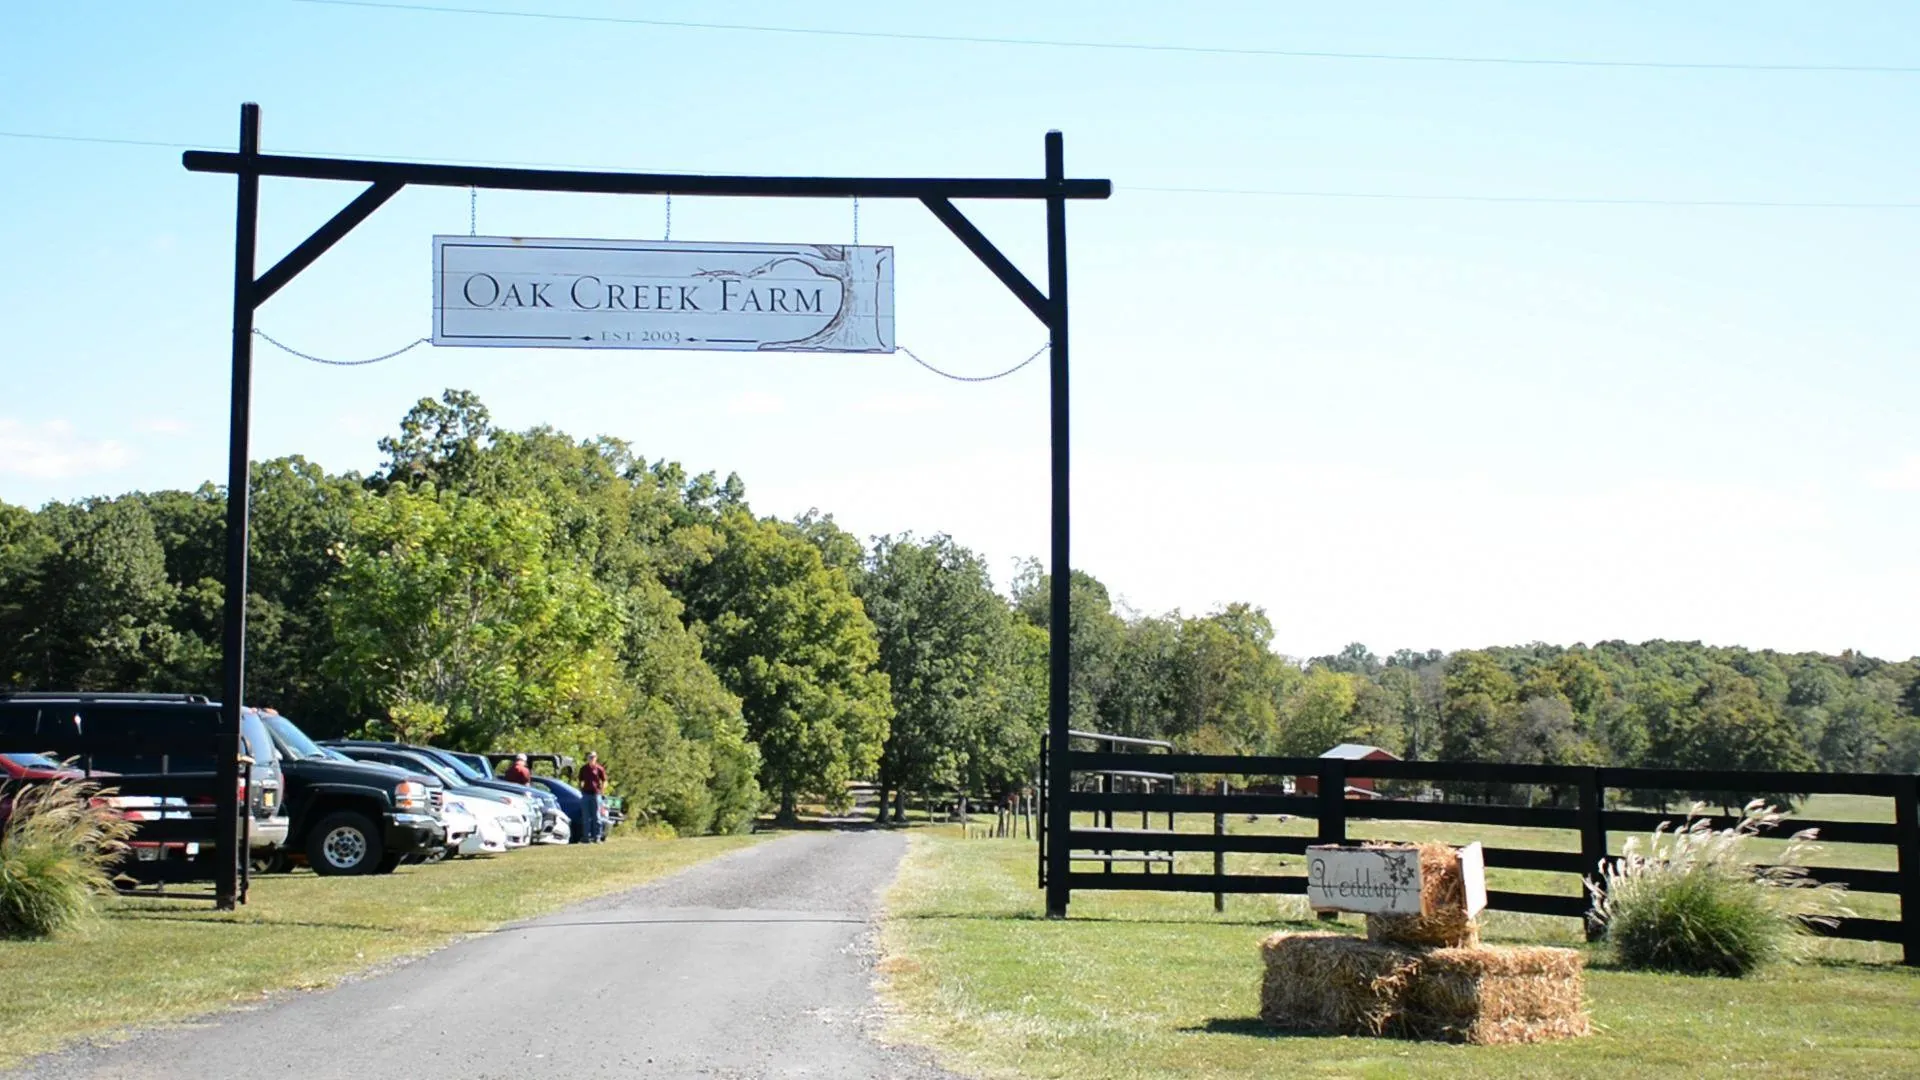
A Virginia wedding reference
A practical, source-linked look at marriage trends and planning facts for Virginia couples.
Updated November 6, 2026
This page brings together the latest available public figures for Virginia marriages, national context and state licensing facts. Every number below links to its primary source and identifies the year it represents.
Virginia's reported marriage rate in 2024, based on marriages occurring in the Commonwealth.
Source: CDC/NCHS, 2024 dataThe national reported marriage rate in 2024. The federal series excludes several states with unavailable data.
Source: CDC/NCHS, 2024Virginia's 6.0 rate was about 5% below the U.S. reported rate of 6.3 in 2024.
Source: Calculated from CDC/NCHS 2024 ratesVirginia's reported marriage rate moved from 8.8 per 1,000 residents in 2000 to 6.0 in 2024.
Source: CDC/NCHS, 2000 and 2024Virginia's reported divorce rate in 2024. The federal source notes that divorce figures include annulments.
Source: CDC/NCHS, 2024 dataThe federal provisional count of marriages reported nationally in 2024, before the source notes its state-coverage limitations.
Source: CDC/NCHS, 2024 provisional dataVirginia law gives couples 60 days from issuance to solemnize a marriage under the license.
Source: Code of Virginia, currentVirginia law sets a $20 state tax when a marriage license is issued. A local clerk may charge an additional fee.
Source: Code of Virginia, currentA Virginia state report cites 52,085 registered marriages in 2022, alongside 24,887 divorces and annulments.
Source: Virginia Department of Health, 2022Marriage rate trend
These rates represent marriages occurring in Virginia per 1,000 residents. They are useful context for understanding a long-term statewide trend, not a count of weddings held at any one type of venue.
| Year | Virginia marriage rate | Change from 2000 |
|---|---|---|
| 2000 | 8.8 per 1,000 residents | Baseline |
| 2019 | 6.1 per 1,000 residents | 31% lower |
| 2020 | 5.3 per 1,000 residents | 40% lower |
| 2024 | 6.0 per 1,000 residents | 32% lower |
Methodology and sources
We use primary public sources where available. The marriage and divorce rates are reported by the Centers for Disease Control and Prevention's National Center for Health Statistics. Rates are per 1,000 residents and should be read with the source notes for coverage details.
Cite this page
When referencing a figure, link directly to its statistic above and include the source year shown with it.
Oak Creek Farm Weddings, LLC. "Virginia Wedding and Marriage Statistics." Updated November 6, 2026. https://oakcreekfarmva.com/virginia-wedding-statistics
Planning a celebration in Central Virginia? Book a private tour at Oak Creek Farm.